 ★ 4.4 · 423 reviews
Yellowfin BI
Embedded Analytics and BI Solution for Intelligent Reporting
About Yellowfin BI
Yellowfin BI is a business intelligence and analytics platform that enables organizations and software vendors to embed interactive dashboards, AI-powered insights, and automated alerts directly into their applications. It offers a suite of tools including natural language query (NLQ), automated data storytelling, and real-time signals, making advanced analytics accessible to users across the enterprise. With Yellowfin, users can ask questions in plain language, get instant visualizations, and receive AI-generated explanations of trends. The platform is designed to integrate seamlessly into existing workflows, delivering a native analytics experience that drives adoption and business value. AiDOOS enhances Yellowfin deployment by providing expert implementation services, ensuring rapid setup, customization, and ongoing optimization. Whether you are an ISV looking to differentiate your product with embedded analytics or an enterprise seeking a secure, scalable BI solution, Yellowfin BI combined with AiDOOS offers a comprehensive path to data-driven decision-making.
Challenges It Solves
- Difficulty extracting insights from complex data quickly and accurately
- Time-consuming and costly development of in-house analytics capabilities
- Low adoption of BI tools due to lack of user-friendly interfaces
- Need for real-time monitoring and alerts to react to business changes promptly
Screenshots


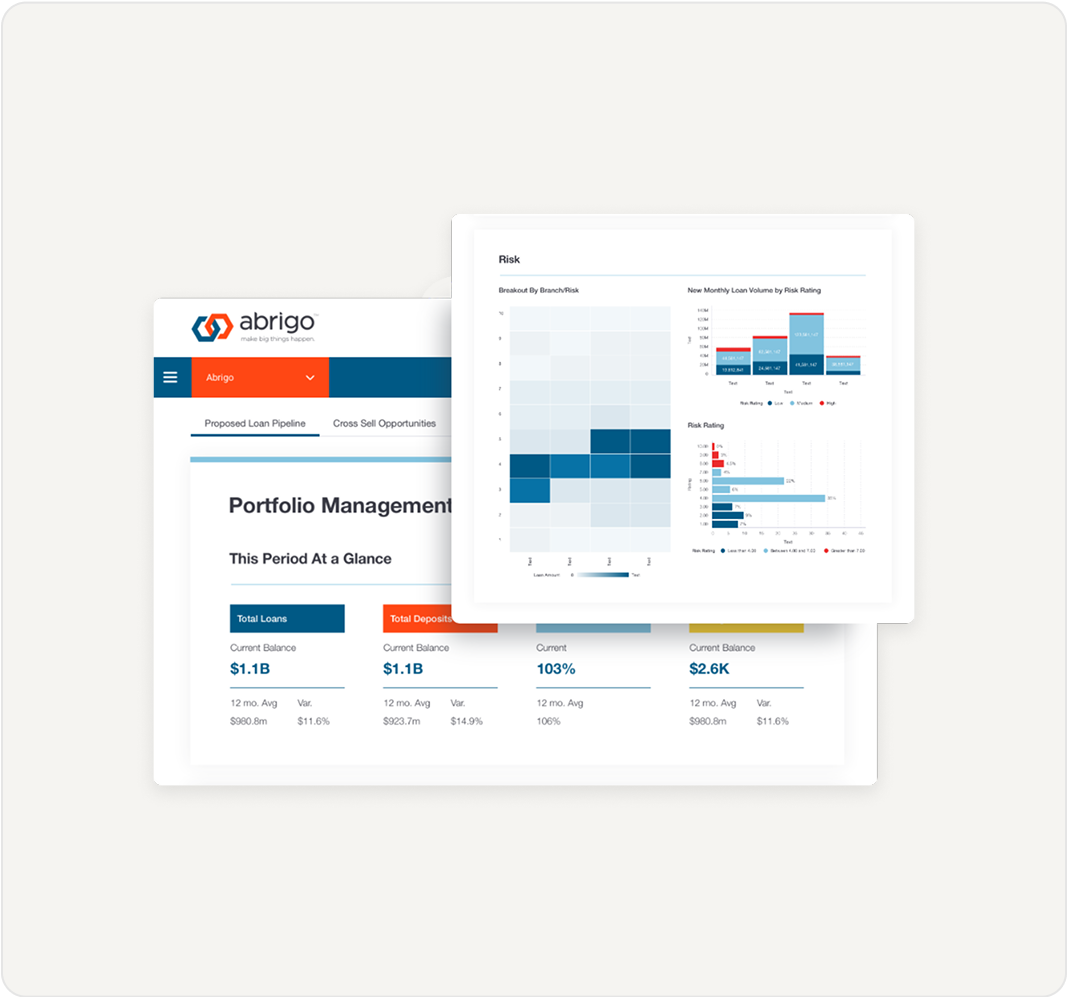

Watch Demo

Use Cases
Embedded Analytics for ISVs
Software vendors can integrate Yellowfin into their products to deliver analytics experiences that feel native, increasing user engagement and generating new revenue streams.
Self-Service Business Intelligence
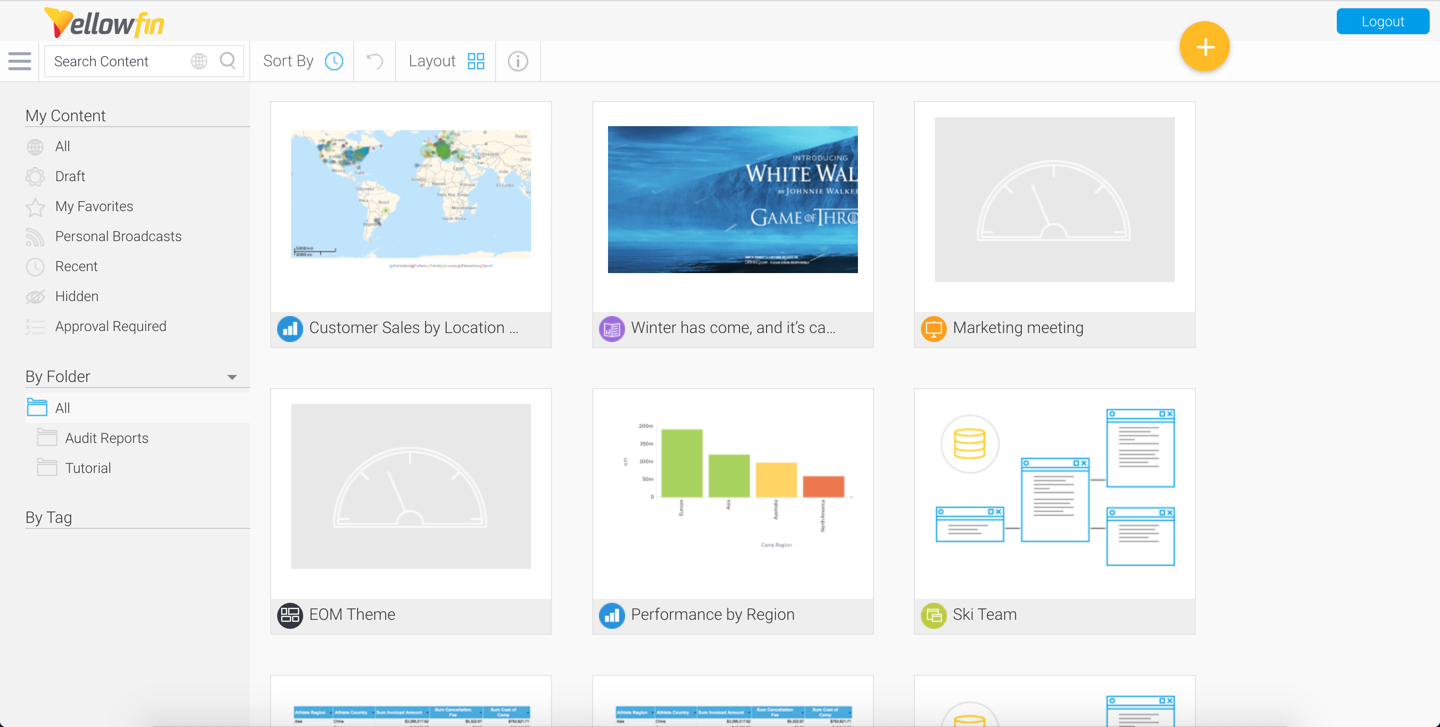
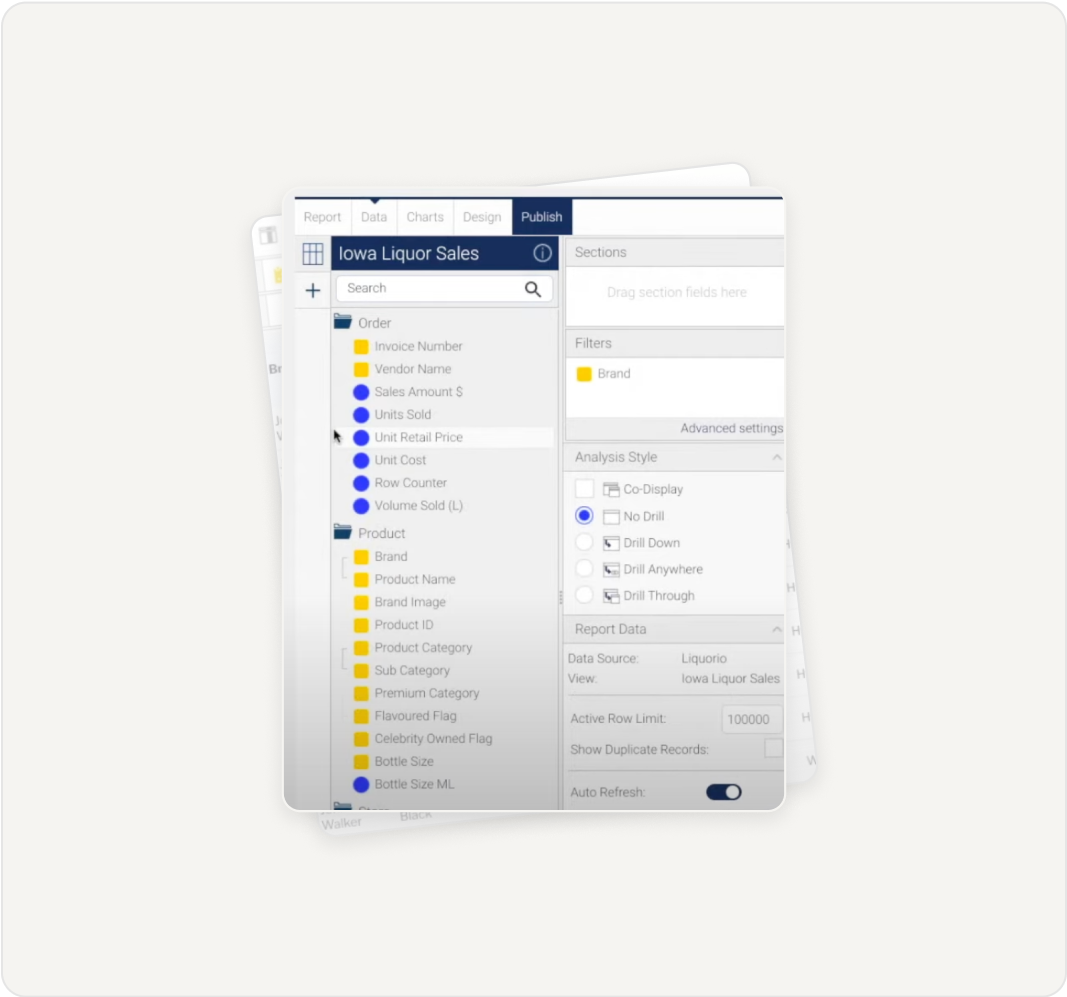
Business users can independently create reports and dashboards using natural language queries and drag-and-drop tools, reducing IT dependency.
Automated Business Monitoring
Organizations can set up threshold-based alerts to monitor key metrics in real time, ensuring they never miss critical changes or anomalies.
Data Storytelling for Executive Reporting
Teams can create compelling, data-driven presentations that combine charts, tables, and narrative text to communicate insights effectively to stakeholders.
Pricing
Custom pricing — built for your team
Yellowfin BI pricing is tailored to your organisation's size, integrations, and requirements. AiDOOS generates your proposal instantly — scoped & ready in seconds.
Key Features
Ask questions in plain language and get instant visualizations.
AI-powered alerts that automatically detect significant changes and outliers in your data.
Create narrative-driven presentations by combining charts, tables, and AI-written summaries.
Easily integrate White-label dashboards and analytics into your own software application.
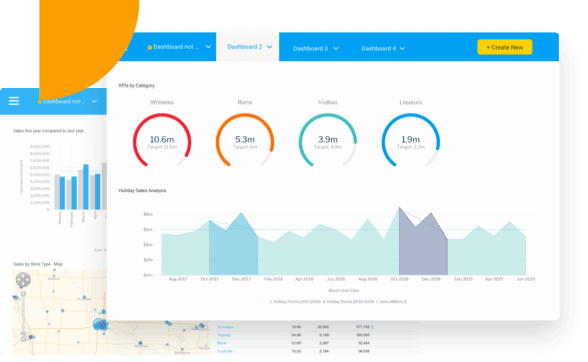
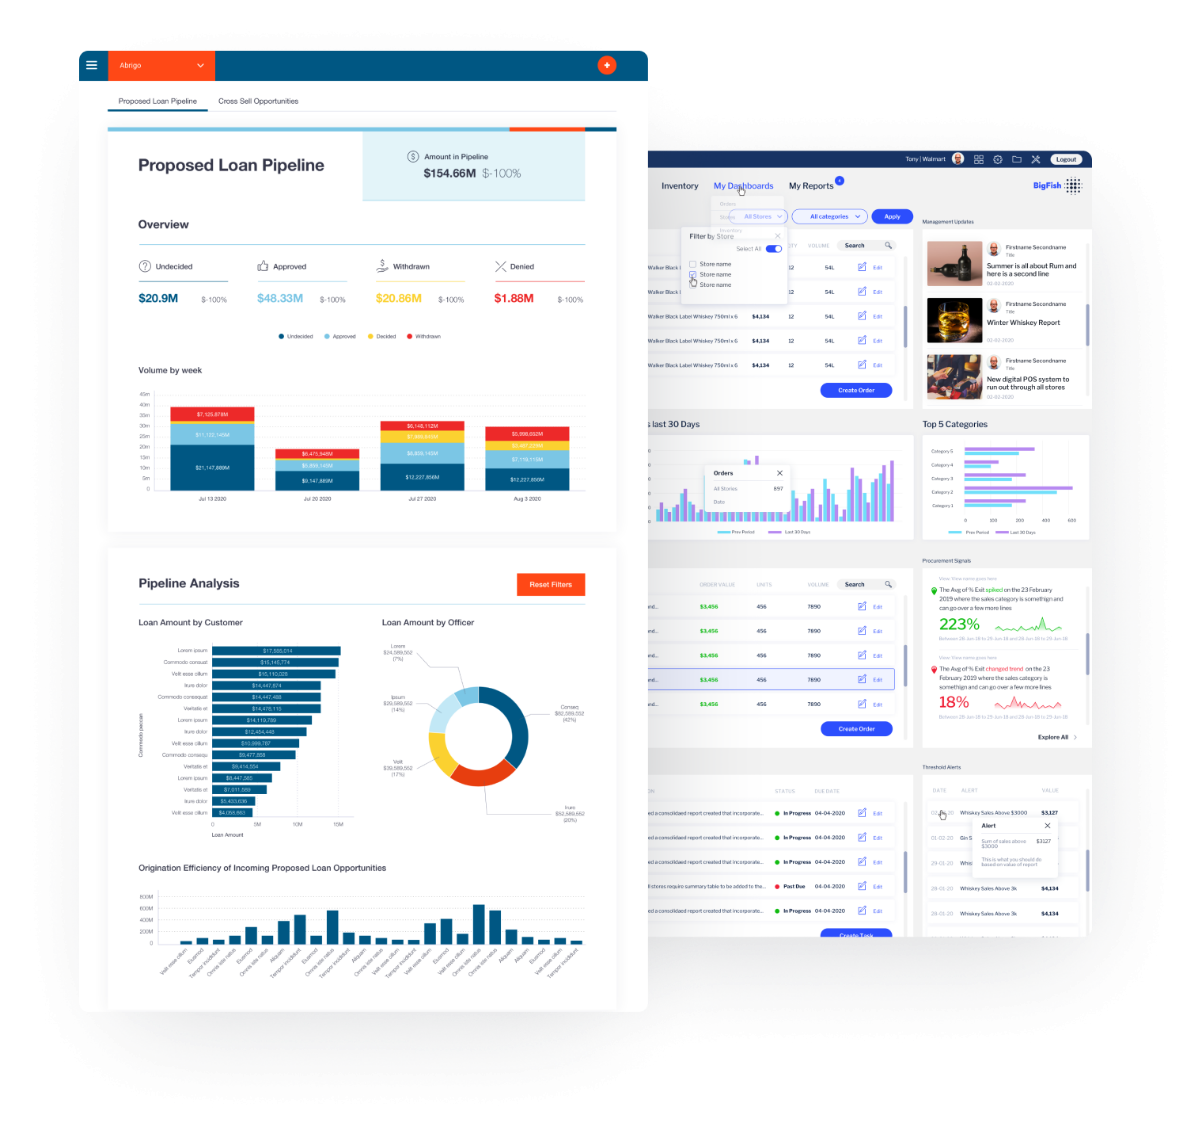
Design beautiful, action-based dashboards that provide at-a-glance insights and support drill-downs.
Get plain-English explanations for trends and anomalies, making AI insights transparent and trustworthy.
What Reviewers Say AI-synthesized from 423 reviews
What works well
- Ease of use and intuitive dashboards enhance data visualization and simplify reporting.
- Robust embedded analytics capabilities allow seamless integration into applications.
- AI-driven features like NLQ and automated insights accelerate time-to-insight.
Common concerns
- Limited advanced data preparation and data modeling capabilities compared to some competitors.
- Pricing is not transparent; may be costly for smaller organizations.
Reviews
423 verified reviewsReviewer Demographics
Top Industries
No data available
Enterprise Readiness
Identity & Access
Data Security
SLA & Availability
Compliance & Portability
Integrations
Google Analytics
Import web analytics data into Yellowfin for visualization and reporting.
Salesforce
Connect to Salesforce data for sales analytics and dashboards.
Microsoft SQL Server
Use SQL Server as a data source for reports and dashboards.
Amazon Redshift
Query and analyze data stored in Redshift for large-scale analytics.
Google BigQuery
Connect to BigQuery for serverless data analytics and visualizations.
Oracle Database
Use Oracle Database as a data source for enterprise reporting.
SAP
Integrate SAP data for operational and financial reporting.
Zendesk
Analyze customer support tickets and metrics in Yellowfin dashboards.
Governance & Compliance
EU AI Act
No data available
Data Processing Agreement
No data available
Sub-processors
No data available
Right to Erasure
No data available
Change Notifications
No data available
NIST AI RMF
No data available
AiDOOS Managed Deployment
Deploy Yellowfin BI in 72 hours
AiDOOS handles setup, CRM integration, SSO config, and user provisioning. Your team goes live — not your IT department.
Prerequisites
- Yellowfin license
- Access to data sources (e.g., SQL server, cloud)
- Admin credentials for SSO and user provisioning
- Dedicated server or cloud environment
Configuration Options
- Embedded analytics setup
- Custom branding and white-labeling
- Integration with existing SSO (SAML/OAuth)
- Data source connectors configuration
How Yellowfin BI Compares
| Product | AI & Analytics | Ease of Use | Enterprise Features | Pricing | Integrations | Mobile Experience | Quick Setup | Customer Support | Rating | Price/mo |
|---|---|---|---|---|---|---|---|---|---|---|
|
Y
Yellowfin BI This product
|
Excellent | Good | Excellent | Fair | Good | Good | Good | Good | ★ 4.4 | $Custom/user |
|
PB
Microsoft Power BI
|
Excellent | Excellent | Excellent | Excellent | Excellent | Excellent | Excellent | Good | ★ 4.5 | $10/user |
|
TB
Tableau
|
Excellent | Good | Excellent | Poor | Excellent | Excellent | Good | Good | ★ 4.5 | $75/user |
|
QK
Qlik Sense
|
Excellent | Good | Excellent | Good | Good | Excellent | Good | Good | ★ 4.4 | $30/user |
A Virtual Delivery Center for Yellowfin BI
Pre-vetted experts and AI agents in the loop, assembled as a delivery pod. Pay in Delivery Units — universal pricing across roles, seniority, and tech stacks. No hiring, no contracting, no procurement cycle.
- Plans from $2,000 — Starter Pack, 10 Delivery Units, 90 days
- Refundable on unused Delivery Units, anytime — no questions asked
- Re-delivery guarantee on acceptance miss
- Pre-flight delivery sizing — you see the plan before you commit
How a Virtual Delivery Center delivers Yellowfin BI
Outcome-based delivery via AiDOOS’s VDC model. Why VDC vs traditional consulting? →
Outcome-Based
Pay for results, not hours
Milestone-Driven
Clear deliverables at each phase
Expert Network
Access to certified specialists