 ★ 4.3 · 406 reviews
Sumo Logic
Intelligent Operations for the AI era
About Sumo Logic
Sumo Logic is a cloud-native SaaS platform that provides log management, monitoring, and security analytics, including SIEM and security data lake capabilities. It enables organizations to collect, analyze, and act on data from their applications and infrastructure. The platform offers real-time insights and AI-driven automation to help security teams detect threats, investigate incidents, and streamline compliance. With over 450 integrations, Sumo Logic supports diverse data sources and provides a unified view across hybrid and multi-cloud environments. The product leverages flexible licensing and is designed to handle high-volume data at scale. Sumo Logic's security features include user and entity behavior analytics (UEBA), automated alert triage, and compliance certifications like SOC 2 Type II, FedRAMP Moderate, and PCI DSS. For implementation, AiDOOS enhances deployment by providing expert consulting services to ensure smooth integration, configuration, and adoption, tailored to an organization's specific needs. AiDOOS helps maximize the value of Sumo Logic, enabling teams to reduce mean time to respond and improve overall security posture.
Challenges It Solves
- Security teams are overwhelmed with a high volume of alerts, leading to alert fatigue and uninvestigated threats.
- Manual security operations workflows slow down incident response and increase risk.
- Cloud and multi-cloud environments create data silos that hinder comprehensive visibility.
- Traditional SIEM solutions are expensive and complex to scale, straining security budgets.
Screenshots


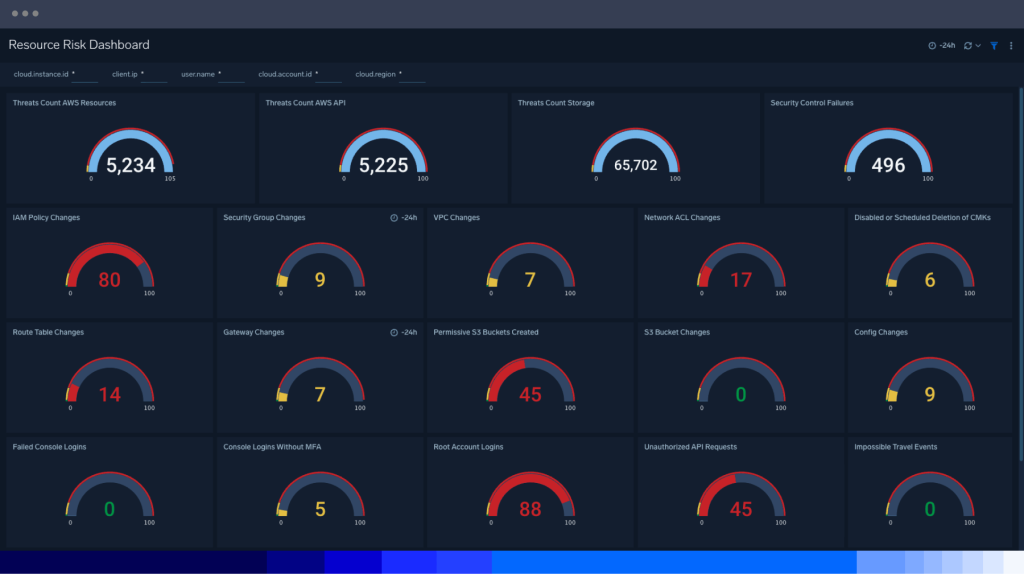
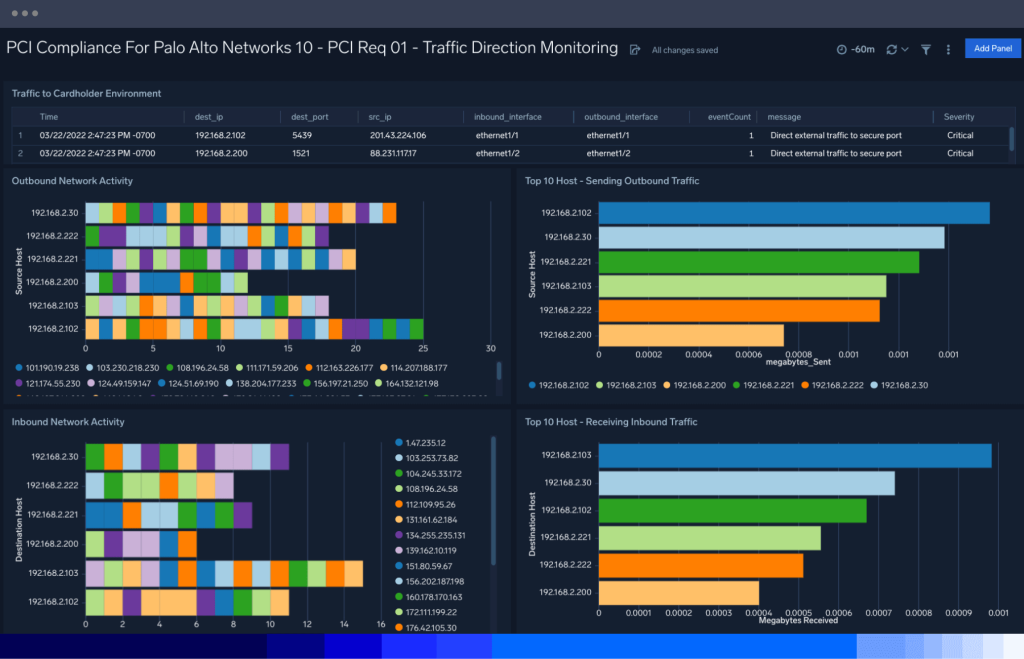
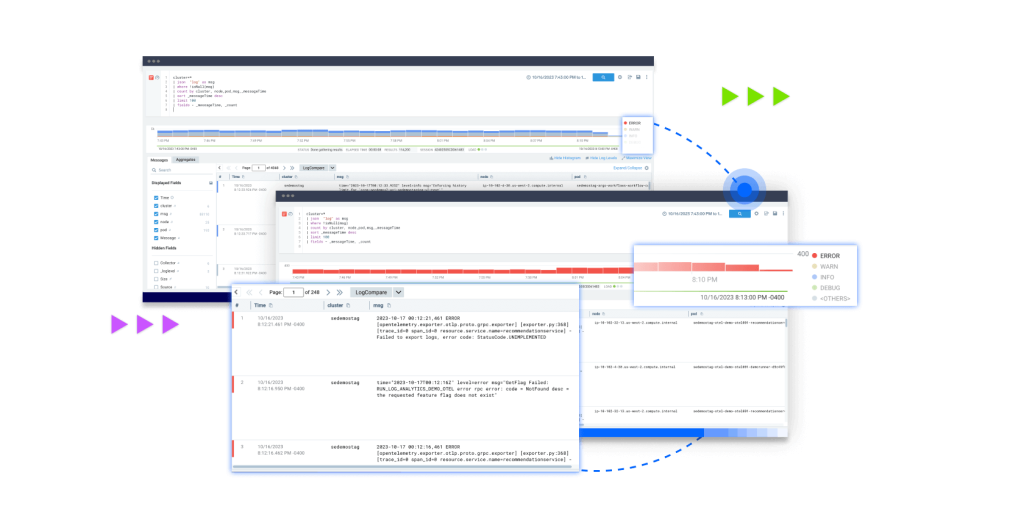


Use Cases
Security Operations
Accelerate threat detection, investigation, and response with AI-guided insights and automation.
Compliance and Audit
Streamline compliance with pre-built dashboards for PCI, HIPAA, and other standards.
Cloud Infrastructure Monitoring
Monitor and troubleshoot applications and infrastructure across multi-cloud environments.
Pricing
Custom pricing — built for your team
Sumo Logic pricing is tailored to your organisation's size, integrations, and requirements. AiDOOS generates your proposal instantly — scoped & ready in seconds.
Key Features
Automatically detects and correlates threats in real-time across cloud, on-premises, and hybrid environments.
Centralizes cloud-specific logs from AWS, Azure, and GCP to enhance visibility and threat detection.
A multi-agent AI platform that automates alert triage and guides investigations with AI-driven insights.
Pay only for the data you use, with the ability to ingest everything without budget waste.
User and Entity Behavior Analytics to identify abnormal behavior and insider threats.
Create custom automated workflows to enrich alerts and accelerate incident response.
What Reviewers Say AI-synthesized from 406 reviews
What works well
- Easy to use and provides real-time insights that enhance log monitoring and analysis efficiency.
- Cloud-native architecture offers scalability and flexibility to handle high-volume data.
Common concerns
- Pricing can be complex and potentially expensive for larger data volumes.
- Some users report a learning curve for advanced query language and features.
Reviews
406 verified reviewsReviewer Demographics
Top Industries
No data available
Company Size
No data available
Enterprise Readiness
Identity & Access
Data Security
SLA & Availability
Compliance & Portability
Integrations
450+ total appsOkta
Integrates Okta identity and access management logs for security analytics.
AWS
Collect and analyze AWS CloudTrail, VPC Flow, and other logs for security and monitoring.
Azure
Ingest Azure activity logs and security logs for unified security monitoring.
Google Cloud
Collect logs from Google Cloud Platform services for security and analytics.
Office 365
Analyzes Office 365 audit logs for security and compliance insights.
Governance & Compliance
EU AI Act
No data available
Data Processing Agreement
Standard Contractual Clauses DPA available
Sub-processors
Fully disclosed
Right to Erasure
No data available
Change Notifications
No data available
NIST AI RMF
No data available
AiDOOS Managed Deployment
Deploy Sumo Logic in 72 hours
AiDOOS handles setup, CRM integration, SSO config, and user provisioning. Your team goes live — not your IT department.
Prerequisites
- Sumo Logic account
- Admin access for SSO configuration
- Cloud provider credentials for log collection
Configuration Options
- Configure built-in integrations
- Set up custom log sources
- Define roles and permissions
How Sumo Logic Compares
| Product | AI & Analytics | Ease of Use | Enterprise Features | Pricing | Integrations | Mobile Experience | Quick Setup | Customer Support | Rating | Price/mo |
|---|---|---|---|---|---|---|---|---|---|---|
|
S
Sumo Logic This product
|
Excellent | Good | Excellent | Good | Excellent | Fair | Good | Good | ★ 4.3 | $Custom/user |
|
SP
Splunk
|
Excellent | Fair | Excellent | Poor | Excellent | Fair | Fair | Good | — | $Custom/user |
|
DD
Datadog
|
Good | Good | Good | Fair | Excellent | Good | Good | Good | — | $15/user |
|
LR
LogRhythm
|
Good | Fair | Good | Fair | Good | Poor | Fair | Good | — | $Custom/user |
A Virtual Delivery Center for Sumo Logic
Pre-vetted experts and AI agents in the loop, assembled as a delivery pod. Pay in Delivery Units — universal pricing across roles, seniority, and tech stacks. No hiring, no contracting, no procurement cycle.
- Plans from $2,000 — Starter Pack, 10 Delivery Units, 90 days
- Refundable on unused Delivery Units, anytime — no questions asked
- Re-delivery guarantee on acceptance miss
- Pre-flight delivery sizing — you see the plan before you commit
How a Virtual Delivery Center delivers Sumo Logic
Outcome-based delivery via AiDOOS’s VDC model. Why VDC vs traditional consulting? →
Outcome-Based
Pay for results, not hours
Milestone-Driven
Clear deliverables at each phase
Expert Network
Access to certified specialists