"My Go-To Tool - Frees Up Mental Space to Focus on the Work Rather Than Holding All Context"
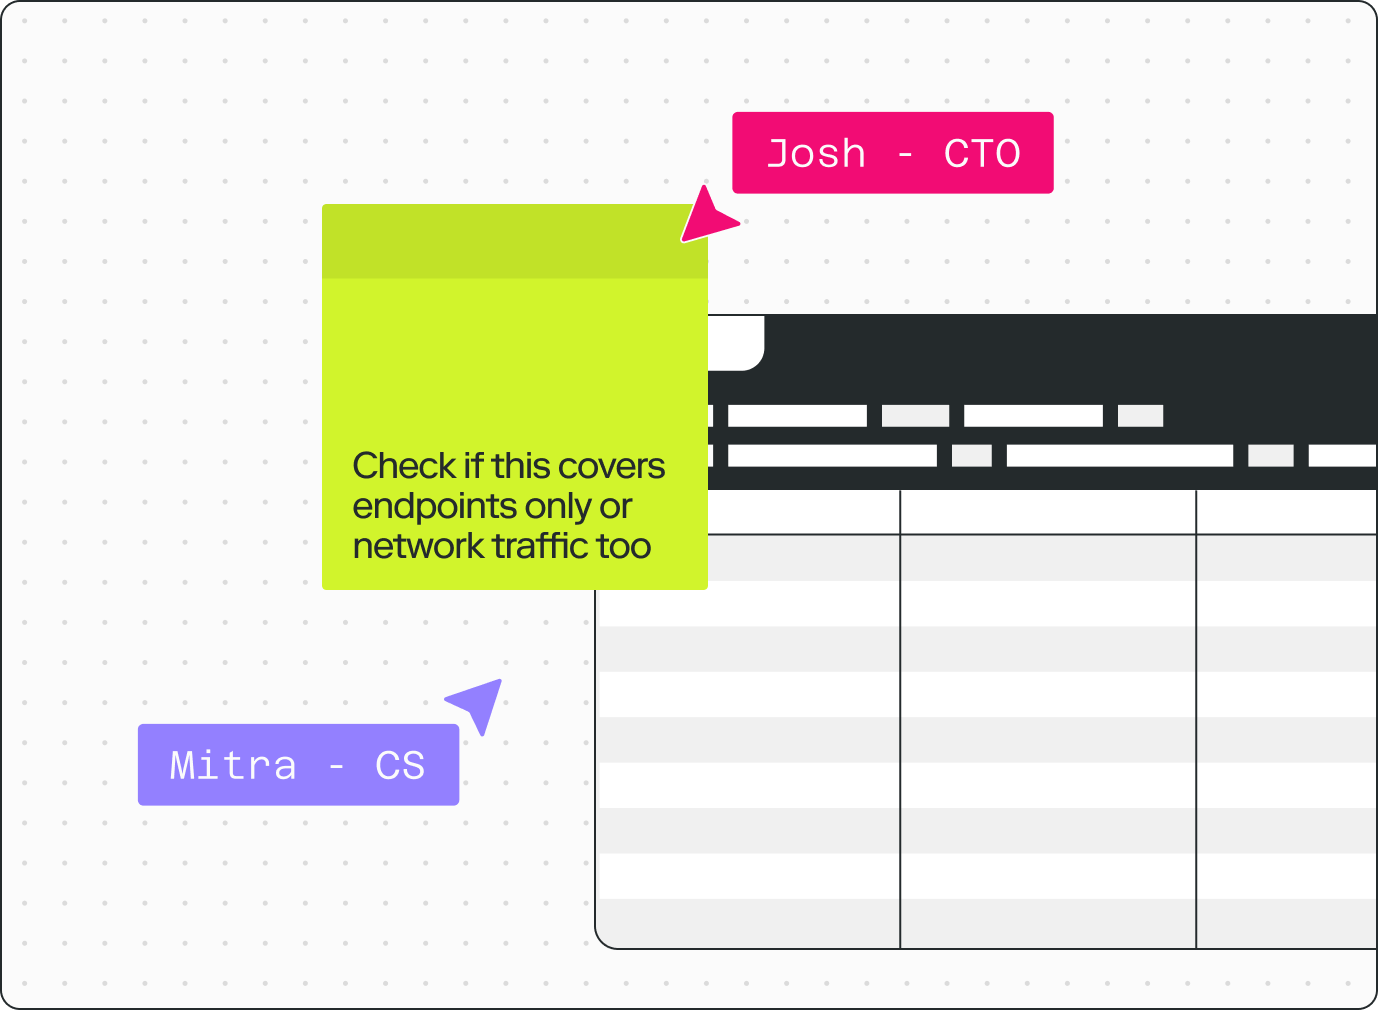
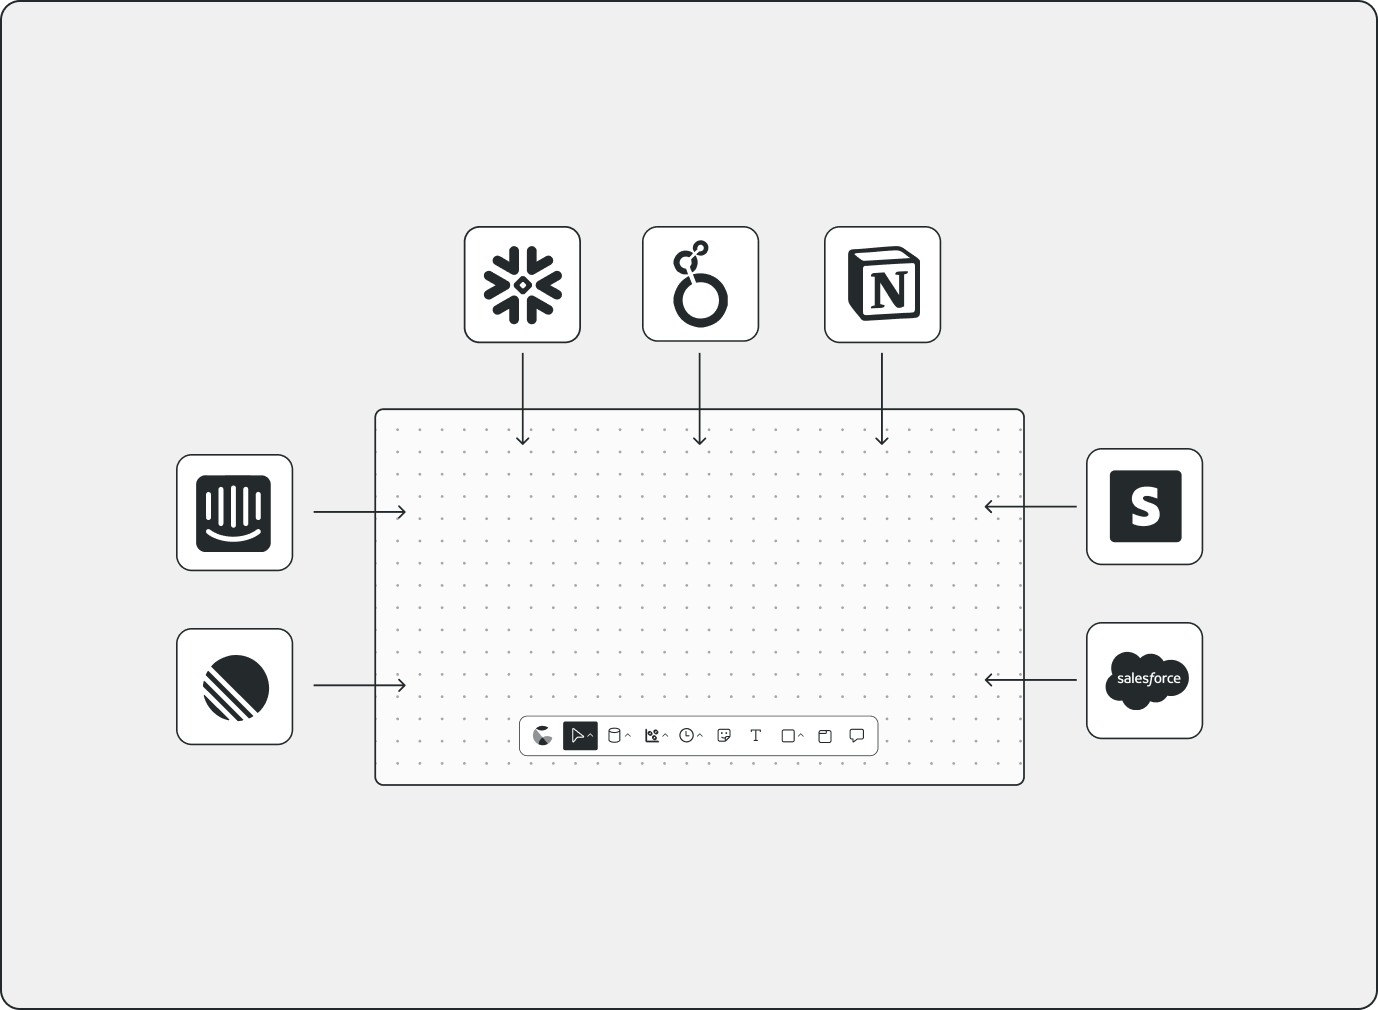
Count has become the first place I go when working with our data, and I usually don't leave. Where context used to be stored across multiple tabs, Miro boards, Figma designs, spreadsheets, and more, I can now pull everything into one canvas and work alongside it. I don't need to keep it all in my head anymore.
Having all the context in the same place also helps when returning to something after time away - there's no need to search for requirements or alternate versions; everything can be dropped into one place. Working with large datasets can be a little challenging. There is a tension between breaking out CTEs for visibility and aggregating early for efficiency. Finding the right balance has taken a little while.
We're using Count to map user journeys, spec new events, analyze split tests, metric reporting, develop data models, and more. We're still bedding the tool in, but have already seen particular benefit in collaboration within the team as well as sharing analysis or designs with other stakeholders.
"Great for SQL, Python & Visualizations, But Needs Cleaner Code and Change Tracking"
Works well with SQL, Python, and visualizations; however, the codebase can be messy and there is no tracking of changes. Product analytics.
H
Head of Data and Analytics
"All-in-One Data Solution That Streamlines Our Workflow"
The flexibility and simplicity of having one tool for many purposes means Count is our primary tool within the Data and Analytics team, and it does most jobs so well that it's hard to justify using anything else!
An example project may involve exploring and interrogating data directly in our warehouse, combining it with CSVs to create models and analysis, bringing the stakeholder into the canvas for collaborative work, sharing ideas and progress, then producing ad-hoc insights and analysis directly from the data on slides the stakeholder can share with the business, and finally creating standard interactive reporting/dashboards that are scheduled to refresh for use by the wider business - which we then monitor with Count Telemetry to ensure usage. All of this in one tool, no switching between tools, no copy-pasting analysis or visuals into presentations, no maintaining separate records of notes, ideas, or feedback - it's all in one place.
Since we started using Count, we've received great feedback from across the organization. The speed at which we can work, the almost limitless ability to create visualizations and layouts that make sense, the ease of access, and the admin/governance of users have made it a firm favorite across the board.
In addition to the tool itself, the support from Count and the community they've built is exceptional, and the future roadmap is always clearly driven by customers and their feedback. Due to its virtually unhindered flexibility compared to other tools, it can sometimes be difficult to figure out how to do something you know should be obvious (e.g., moving a legend), and there is an initial learning curve. However, once you become more familiar with the concept and UI (which doesn't actually take very long), these things become easily solvable.
- Simplifying and speeding up access to data and analytical capability for the Analytics team, enabling them to work with stakeholders in a much more effective and timely manner.
- Consolidating reporting and creating a 'single source of truth' that can be further interrogated, providing consistency and trust in the data that leads to faster and more effective decision-making.
- Bringing stakeholders into a single tool for reporting, analysis, and collaboration has really improved engagement, understanding, and data usage.
- Managing access and users via 'Groups' in a single tool has dramatically reduced admin time and enhanced governance of data access.
M
Mid-Market (51-1000 emp.)
"Excellent for Collaboration and Storytelling"
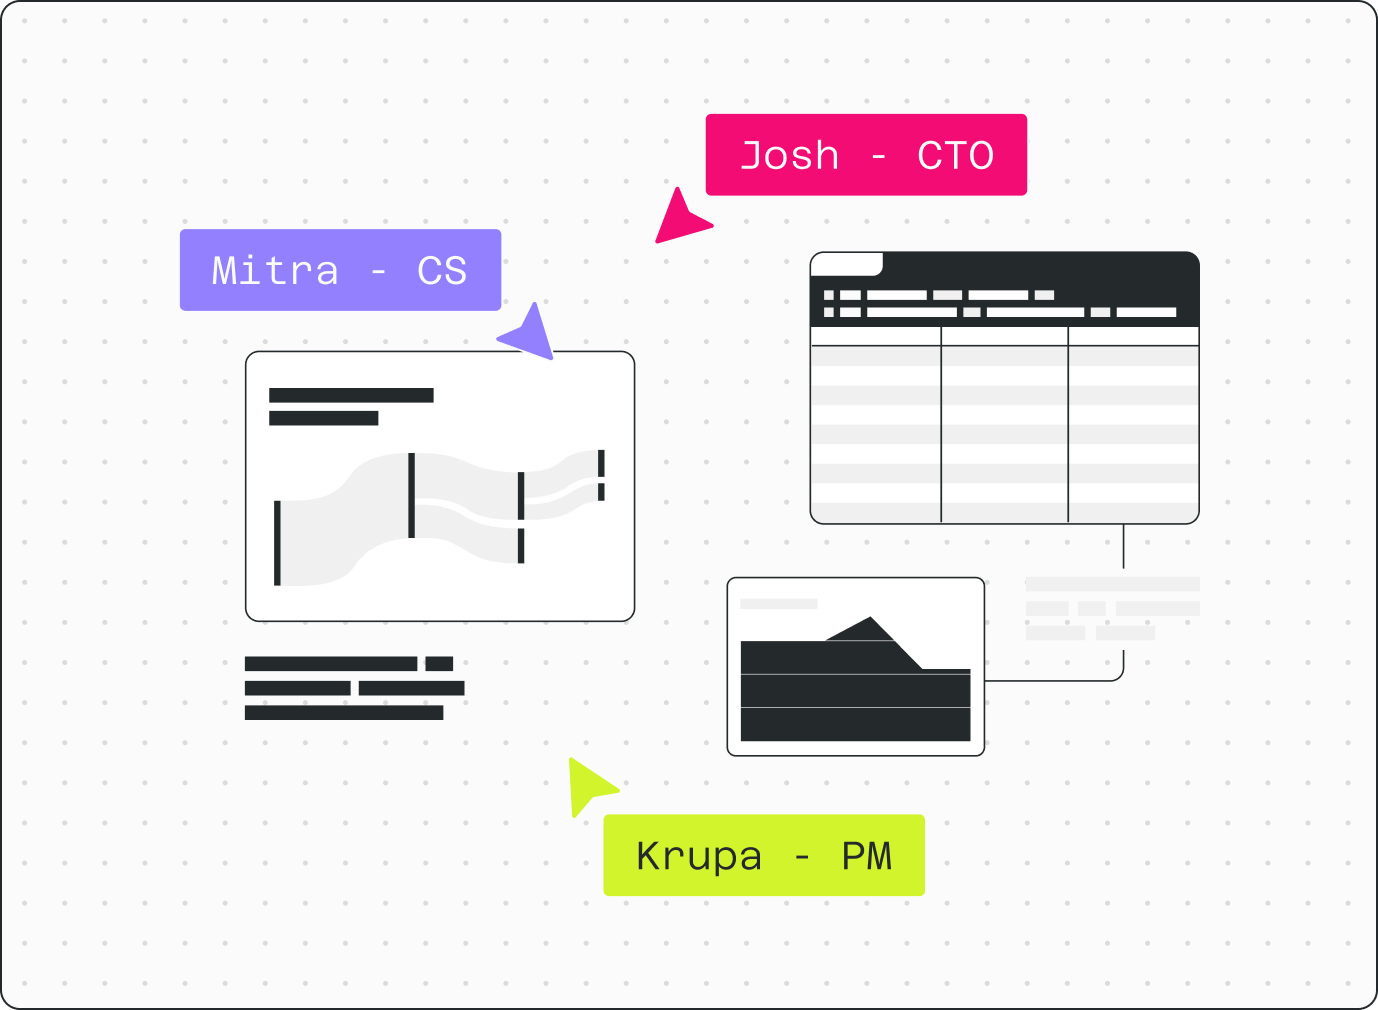
I really value the collaborative aspect and how it enables smooth, natural storytelling. You can also tell that the team is passionate about building the best product for their customers. I'm delighted to have this as part of my analytical toolbox! Not many complaints, but as someone who writes SQL in BigQuery/dbt, the switch to DuckDB syntax can be a bit annoying. However, I appreciate the performance benefits of DuckDB, so I understand their decision. It solves the problem that most legacy and older BI tools don't by enabling collaborative and agile analytics. I love how I can work on a piece of analysis or project with multiple analysts simultaneously.
M
Mid-Market (51-1000 emp.)
"Count Is a Reliable Choice"
I truly appreciate how flexible and user-friendly Count is. The layout is intuitive, and there is a growing list of useful features available. The output is also very polished for creating reports, allowing for creative visualizations and offering numerous templates for inspiration. Count is still evolving, so occasionally there are minor issues, but the customer service team is excellent and always ready to assist. It genuinely feels like a company that supports its customers and aims to grow together, which is much appreciated. Count is great and unique for facilitating easy collaboration. This is beneficial for learning, as you can interact during training sessions. It's also excellent for presenting to other teams, and you can do a lot on the fly (e.g., feedback, next steps, and even create visualizations for quick follow-ups).
D
Director of Revenue Operations
"Seamless Data Integration with Flexible SQL and Python in One Dashboard"
I appreciate how straightforward it is to gather data from various sources and consolidate it into a comprehensive, user-friendly dashboard.
Additionally, having the capability to run SQL queries and Python scripts in a single environment simplifies data processing and adds flexibility. This tool does have a learning curve, and you need to overcome that before you can fully appreciate its value. Count enables us to collaboratively process and analyze data from multiple sources, making it easier to extract a wide range of insights.
"Comprehensive Analytics Tool with Exceptional Support"
I've shifted all my analysis work to Count, so I use it daily.
With Count, you can have queries, plots, text, reports, and comments all in one location. I find this extremely valuable because it makes everything self-documenting: the queries supporting the results, the interpretation, and the reviews all reside together. Additionally, real-time collaboration on the same canvas is fantastic.
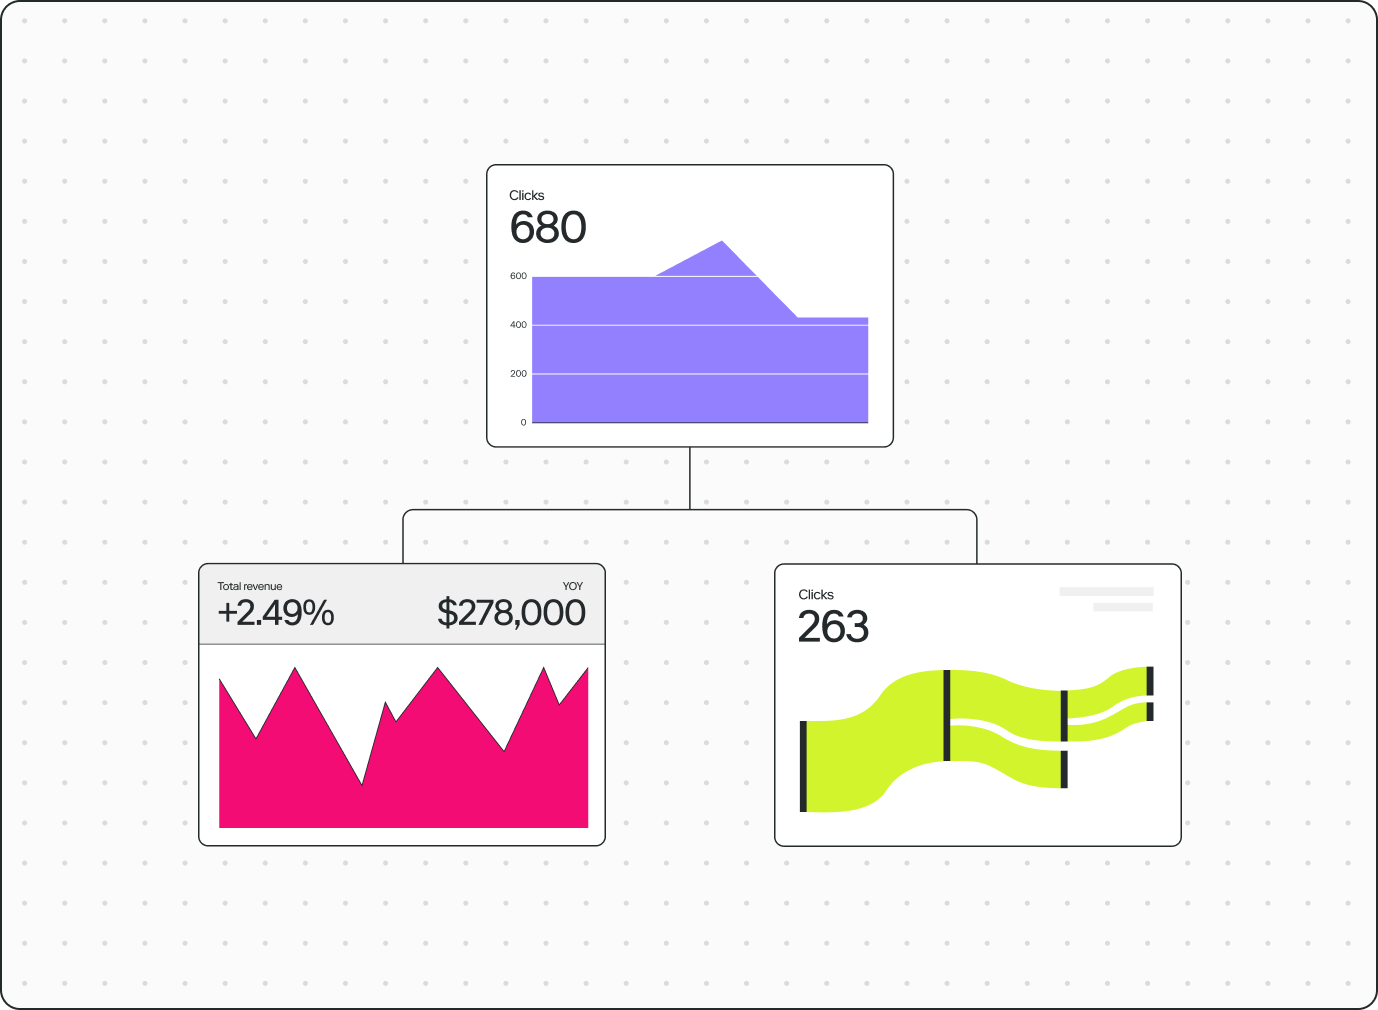
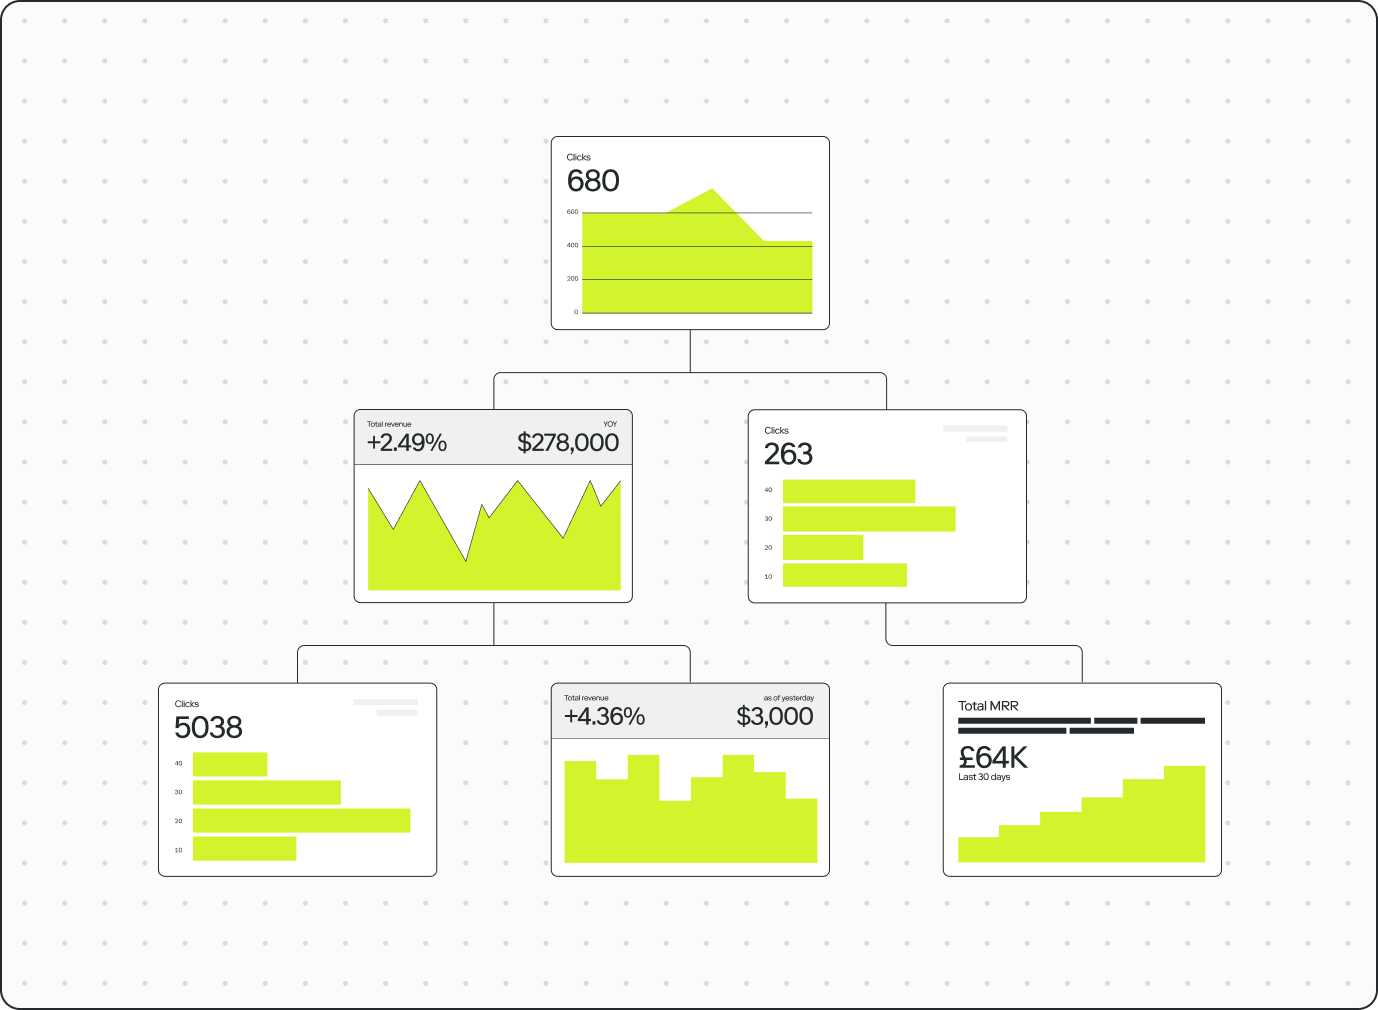
I really like that Count lets you create tiles and reference results, which feels similar to a DAG in dbt. This helps avoid significant code duplication and streamlines query creation. Personally, this is a huge advantage because it allows me to break complex queries into well-defined components and then combine their results as needed.
With other tools, I sometimes felt restricted by inflexible filtering, often managed at the organization level, leading to hacky solutions. With Count, control cells make it easy to implement the exact filters you need, offering great freedom and power to build flexible dashboards.
Finally, I believe Count's support team is excellent. They are consistently helpful, whether I'm stuck or seeking best practices. They either provide a solution or take note of feedback to improve the product. A good example is the recent addition of support for different scales in facet plots, which addressed a limitation I personally encountered.
Regarding areas for improvement, I have a few ideas. I think the construction of frames could be done on a separate canvas, similar to how Tableau approaches dashboards. This would offer the best of both worlds: plots remain close to the queries that generate their data, while still allowing the creation of a dedicated dashboard that brings everything together.
There are also some minor usability issues that can make the interface feel unintuitive at times. For example, when creating custom plots, individual marks cannot be named, making it harder to understand what each mark represents. Similarly, when multiple marks are used, it's not always clear which variable is assigned to the secondary axis.
Some solutions also feel a bit hacky—for instance, adding vertical lines to indicate events by using bar plots, where it's not always obvious how to control the bar width cleanly.
Overall, these are relatively minor points. They don't slow me down in my day-to-day work, and I see them more as a wishlist than as real blockers. As with any tool, there is always room for improvement—but Count is already a superb product. Count solves the problem of fragmented analytics workflows by bringing queries, plots, text, and reviews into a single place, which makes analyses naturally self-documenting. This benefits me because I can always trace results back to their underlying logic and interpretation without losing context. It also addresses code duplication by allowing results to be referenced across tiles, in a way that feels similar to a DAG in dbt. As a result, I can break complex queries into clear, reusable components and iterate much faster.
Count also solves the rigidity of traditional dashboards by giving you control cells to define filters directly in the analysis. This gives me far more flexibility than organization-level filters and avoids the need for hacky workarounds. Another key problem it solves is reviewability: comments, interpretations, and feedback live right next to the data. That makes collaboration easier and decisions easier to justify.
Finally, Count reduces the risk of getting stuck with tool limitations thanks to a very responsive support team. Knowing that feedback is heard and often translated into product improvements makes me confident in relying on Count for my day-to-day analytical work.
"Boundless Canvas Flexibility for Dashboards, Reports, and Data Apps"
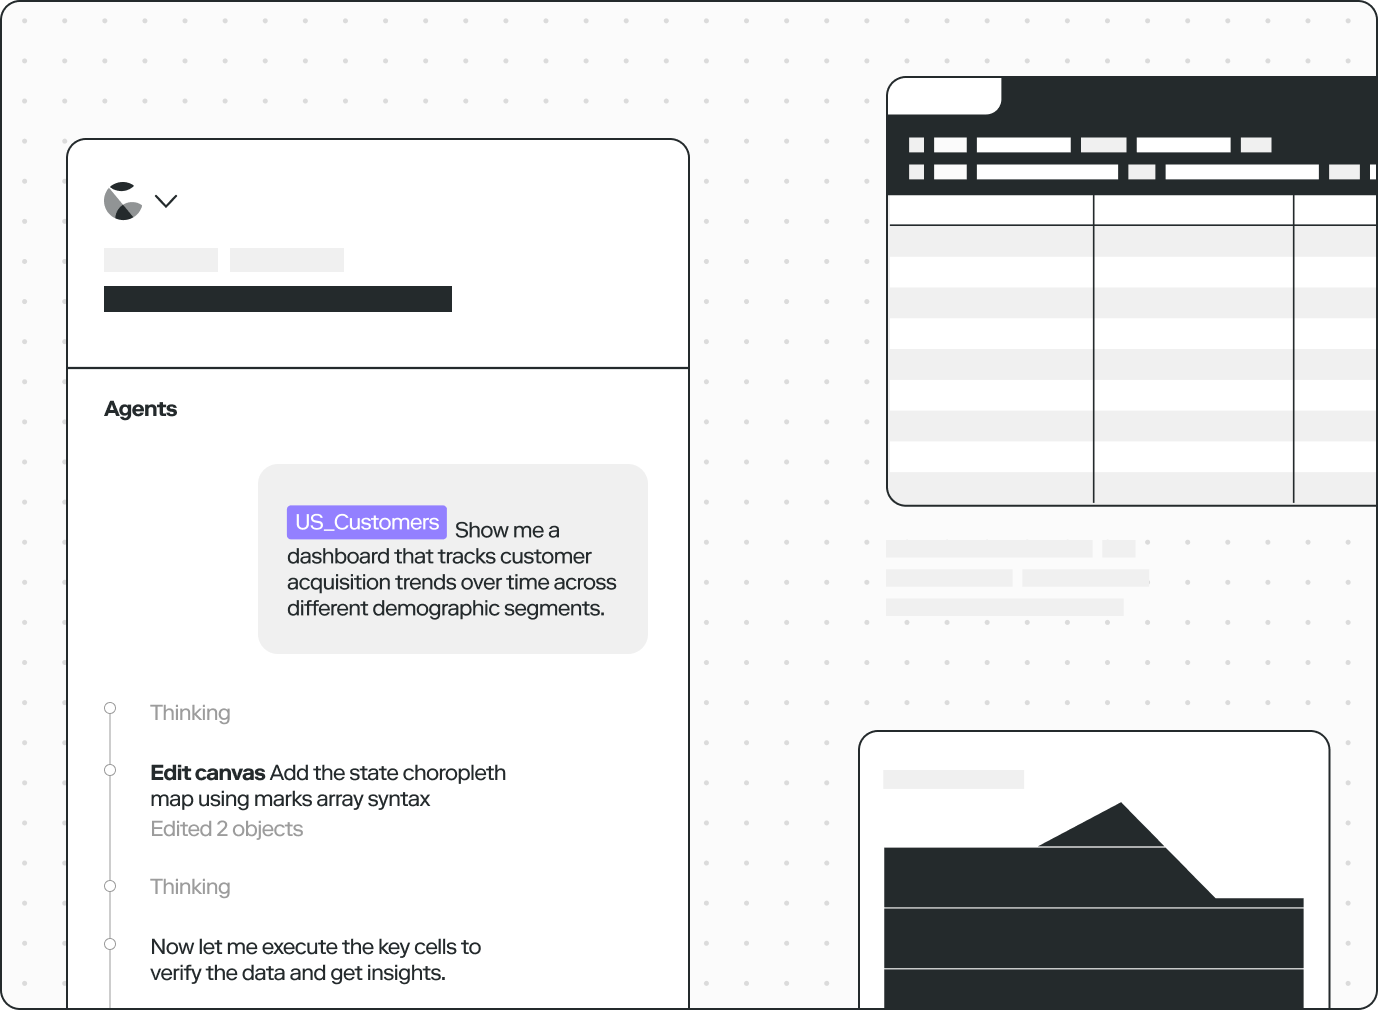
I highly value the flexibility of a canvas that enables us to craft dashboards, reports, and data applications with near-unlimited potential. There's a learning curve for non-data engineers, such as business stakeholders. However, the new AI features are helping to narrow that divide. It accelerates my data analysis when addressing business questions and helps me produce reports more efficiently.
"Flexible, User-Friendly Collaboration for SQL & Python Analysis with Strong LLM Integration"
I appreciate that it serves as a highly adaptable collaboration and analysis tool. It resolves many challenges associated with working alongside other analysts and simplifies sharing analyses with business stakeholders. Additionally, its LLM integration is robust and enhances overall ease of use.
It integrates smoothly with our data warehouse (BigQuery) and is generally quite responsive. The ability to execute both SQL and Python for analyses is very handy. The support team is extremely helpful. I'd like it even more if it offered additional features for locking down reports and building truly reusable dashboards. Currently, it's more of a scratchpad (which is useful), but we still rely on Tableau for our 'gold standard' reports because Count can be quite open and doesn't (as far as I know) allow for completely locking a canvas for dashboard use. Collaboration among data analysts and sharing results with business stakeholders is straightforward.
"Count Brings Together SQL, Python, and Collaborative Data Storytelling"
What stands out most about Count is its capacity to merge SQL, Python, and interactive data narratives within one collaborative platform. It simplifies data exploration, visualization creation, and insight presentation without the need to hop between various applications. Real-time shared notebooks enable teams to collaborate seamlessly on analyses. Support for both SQL and Python offers versatility across diverse data workflows. Interactive visuals refresh automatically as the data evolves. The interface is clean and intuitive, promoting exploratory analysis. Sharing reports and dashboards with stakeholders is straightforward. For me, the standout feature is the live, collaborative notebooks. They facilitate rapid iteration, feedback collection, and ensure everyone operates from a single, consistent data source. The core advantage is enhanced productivity. Count optimizes the path from data querying to interactive report generation, aiding teams in collaborating more efficiently and delivering insights quicker. The primary downside is performance with heavy analytical tasks. While Count handles routine analytics well, large-scale queries and intricate notebooks might need optimization to ensure smooth operation. Dashboard customization isn't as deep as dedicated BI tools. Count addresses the issue of scattered analytics workflows by consolidating SQL, data exploration, visualization, and collaboration into one workspace. Rather than relying on separate platforms for data retrieval, dashboard creation, and insight sharing, Count lets teams accomplish all within a unified collaborative setting. It facilitates collaborative analysis via shared, live notebooks. It merges SQL, visualizations, and documentation in one workspace. It generates interactive reports that update automatically with data changes. It simplifies sharing insights with both technical and non-technical audiences. It minimizes context switching among data querying, reporting, and collaboration tools. In my workflow, Count accelerates exploratory analysis and reporting. I can query data, develop visuals, document findings, and share interactive reports with colleagues without exporting data or moving between systems. The main benefit is improved collaboration and quicker insights. Count cuts down the time from raw data to actionable reports, empowering teams to collaborate more effectively and make data-driven decisions with greater assurance.
 ★ 4.8 · 105 reviews